Ron Lee from the University of California at Berkeley took income data for every age group from the U.S. Department of Labor’s Bureau of Labor Statistics and superimposed that on spending data from the Survey of Consumer Finances (conducted by the University of Michigan working with the U.S. Federal Reserve Board.) In total, the data covers 43 years and therefore evens out the periods when the U.S. economy was growing or contracting at a rapid rate. Also the data is broken out by year, showing no income for individuals under the age of 15 and peak earnings at about age 50.
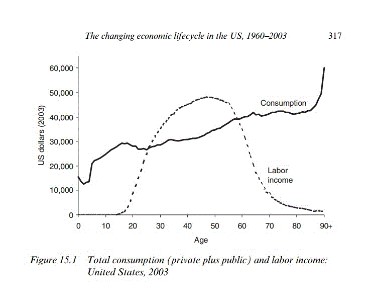
The surprising part of the graph is the consumption line. It shows a decline to $10,000 per person for those under age 5 but then a steady year-by-year increase in spending to $40,000 by age 85 and $90,000 by age 90 and beyond. For the population as a whole, income exceeds consumption only from age 25 to 60. What is available for spending after age 60 depends on the skinny hump over 30 years.
With a crystal ball in hand, the numbers folks among us would like to be able to chart income and spending year by year for individuals and households. However in the absence of a magical ball, we need to do our own forecasting.